Close
CloseElectric vehicles (EVs) made up 17% of global new-car sales in October, as BYD filled the top spots behind Tesla in the model ranking. José Pontes, data director at EV-volumes.com, explores the leading models, brands and manufacturers.
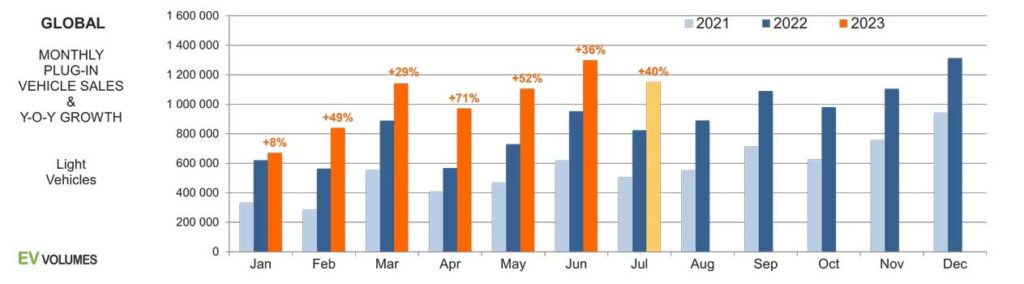
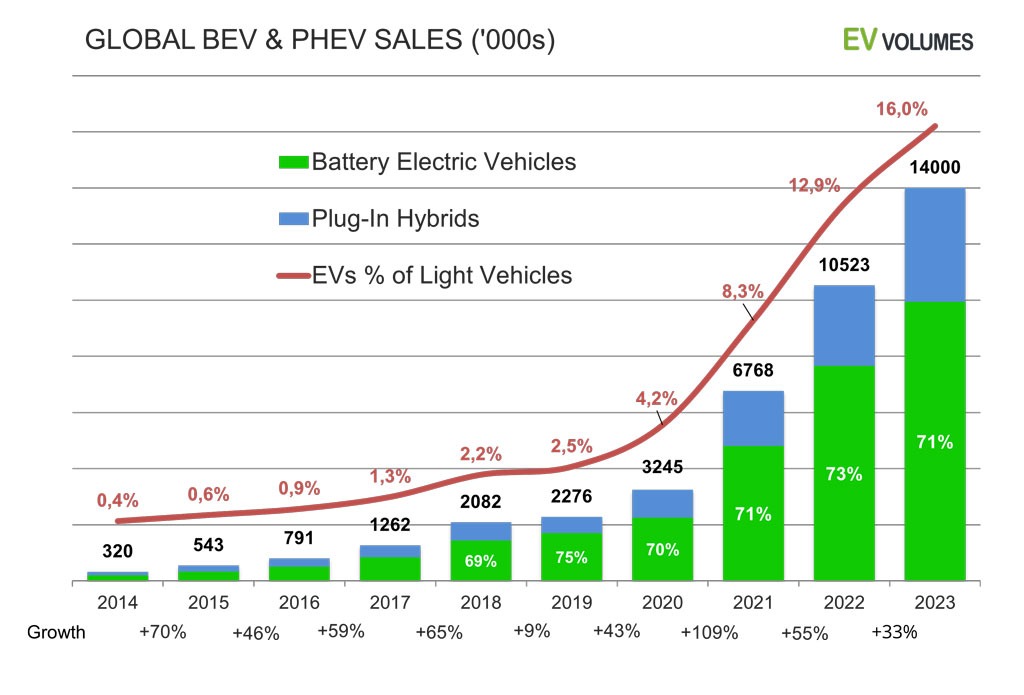
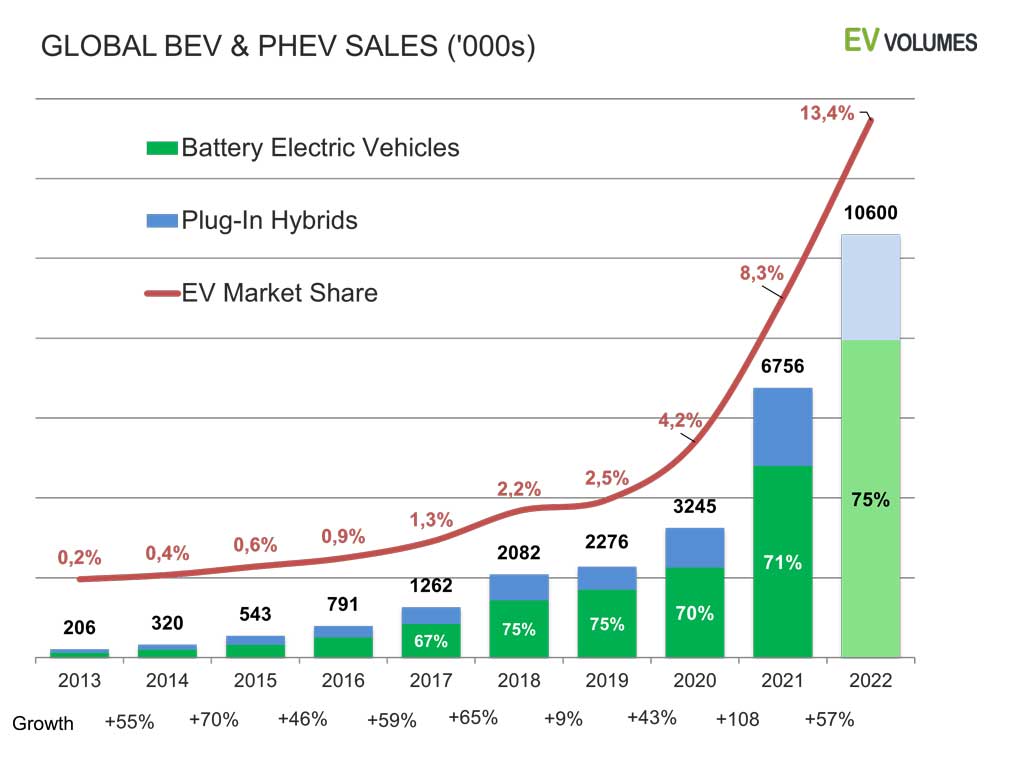
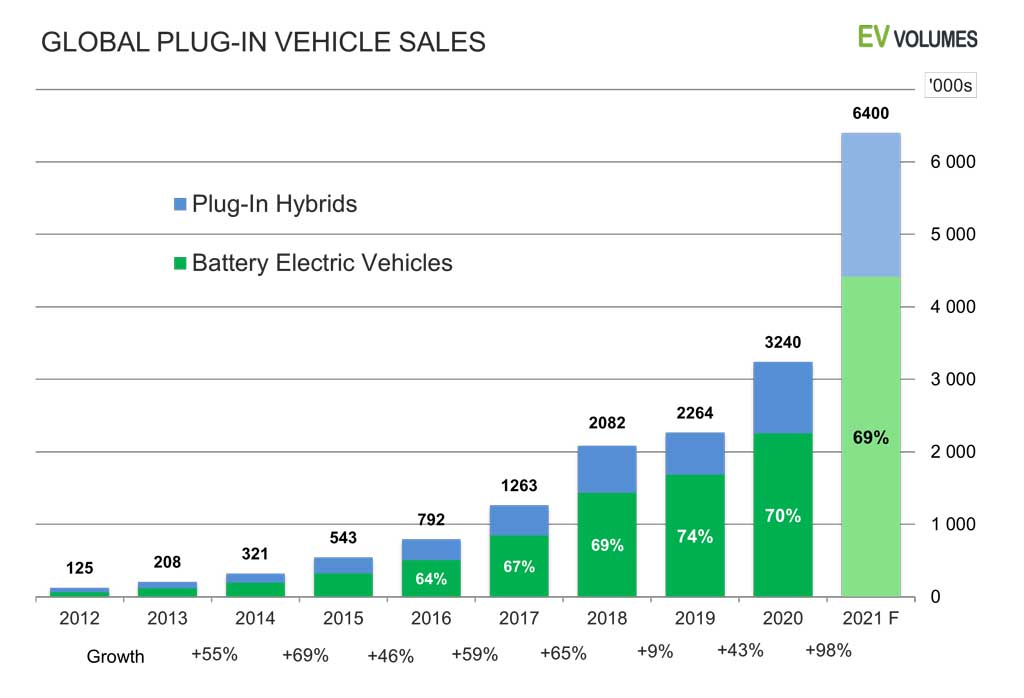
Global EV registrations, made up of battery-electric vehicles (BEVs) and plug-in hybrids (PHEVs), continued to rise in October. A total of 1,279,831 new plug-in vehicles took to roads around the world.
This meant EVs made up 17% of the global new-car market in the month, with BEVs alone taking a 12% share. However, the total electric-vehicle figure narrowly missed September’s record result. As the internal-combustion engine (ICE) market continues its recovery to pre-COVID-19 levels, the EV share is experiencing ongoing pressure.
BEV registrations increased 33% year on year, accounting for 68% of October’s global EV market. This put the year-to-date rise at 70%. PHEV registrations jumped 46% compared with October 2022. This was largely thanks to new range-extended models, with battery capacities over 40kWh, appearing in China. Removing the Chinese market from the tally reveals that PHEV registrations only grew 11% year on year.
Tesla tops BYD batch
The Tesla Model Y remained high above its competitors in October, achieving its best-ever first month in a quarter with 78,250 registrations. This could result in a new record for the crossover come December, with Tesla’s usual quarterly delivery strategy resulting in higher quarterly registrations.
Behind the Model Y, BYD occupied the next five top-ranking spots. The BYD Song took second place with 64,990 registrations, while the Atto 3 ended the month in third with 47,134 units. The Chinese carmaker is leaning further into BEVs, with the Song, Atto 3, Dolphin and Seagull all achieving new records in October with strong all-electric results.
In eighth, the GAC Aion Y continued its record-breaking streak with 27,140 registrations. It was the best-selling non-Tesla, non-BYD model on the table. But this position might be challenged soon, as the now ninth-place Wuling Bingo delivered a record 23,744 units.
In 13th, the Volkswagen (VW) ID.3 had its best result in years, hitting 15,731 units. This was mostly thanks to price reductions in China, which allowed the compact hatchback to reach record registrations. The VW ID.3 and ID.4 were the only models made by legacy manufacturers in October’s top 20, highlighting the disruption caused by the electric vehicle revolution.
Elsewhere, Geely’s Panda Mini hit a new high score of 13,052 units, putting it in 16th. Li Auto’s line-up also performed well, with the 17th-place L9 standing out. The model achieved its third record result in a row with 12,756 registrations.
Largest to smallest
Reviewing the largest to smallest models outside of the top-20, the Huawei-backed Aito M7 SUV hit 11,593 registrations. FAW’s Hongqi E-QM5 sedan broke the five-digit barrier with 10,021 registrations. The Zeekr 001 and Denza D9 also posted solid results, reaching 8,518 and 10,063 registrations respectively.
In the midsize category, the Xpeng G6 reached another record score with 8,741 units, while the Lynk & Co 08 PHEV hit 8,038 registrations in only its third month on the market. The midsize crossover features a 40kWh battery, a capacity which appears to have become the minimum requirement for PHEVs in China.
Other respectable results came from the BMW i4 (7,204 units), the Geely Galaxy L7 (9,336 units), the Leapmotor C11 (8,772 registrations), and the Hyundai Ioniq 5 (8,970 registrations). As for the compact category, the MG4 scored 10,026 registrations in October. Great Wall’s Ora Good Cat managed 9,241 registrations, thanks largely to exports.
In the compact crossover category, the Audi Q4 e-Tron (11,352 units) and the Skoda Enyaq (8,570 units) hit record scores. Meanwhile, the Volvo XC40 (7,905 units) performed respectably ahead of the EX30’s arrival. Most notably in the city EV category, Chery’s QQ Ice Cream registered 7,111 units.
Results set in stone
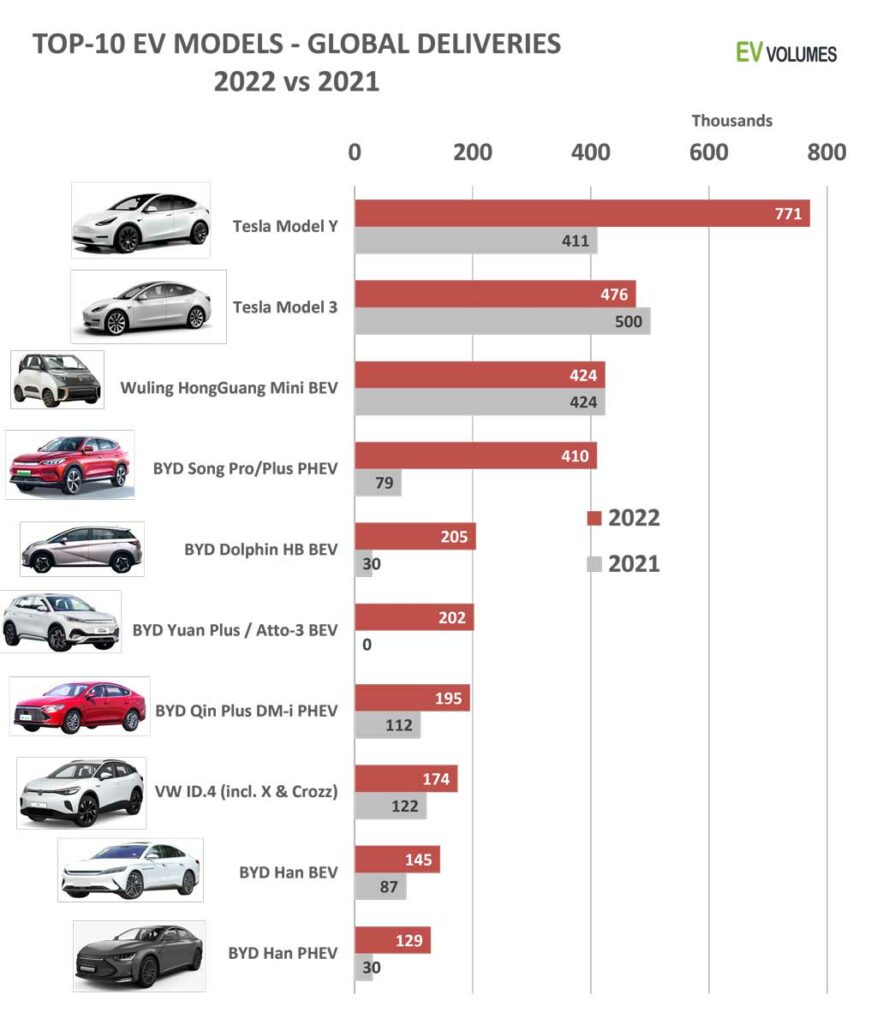
In the year-to-date table, the full-year results appeared set in stone. The Tesla Model Y posted almost twice the sales of the BYD Song. The Chinese model profited from a sizable 80,000-unit advantage over the third-place Tesla Model 3, which managed a 47,000 unit lead over the BYD Qin Plus in fourth.
Therefore, 2023’s headline results will likely mirror those from 2022. The Tesla Model Y will take its second title in a row, followed by the BYD Song with its second silver medal, and then the Tesla Model 3 in third for the second consecutive time.
Further down the table, seventh place is another point of interest during the last quarter of 2023. The GAC Aion S had a slow October, allowing its rivals to draw closer. Its sibling, the GAC Aion Y, jumped two positions to eighth, while the ninth-place Wuling Mini EV and the 10th-place BYD Han could also benefit.
Not far behind, the BYD Seagull swooped into 11th. The city model is poised to join November’s top 10 and could even reach seventh place by the end of the year.
The Wuling Bingo climbed a spot to 14th. While not experiencing the same level of success as its BYD competitors, the Dolphin and the Seagull, Wuling’s supermini is a welcome addition to the EV market and shows great potential as an export.
BYD’s record streak
Considering brands, BYD posted its sixth consecutive registration record in October, with 289,588 units. Tesla delivered 115,055 units, a standard result for the brand in the first month of a quarter. The SGMW joint venture between SAIC and GM-Wuling, took third with 54,921 registrations. The brand is banking on its Wuling Mini EV and Bingo models performing well in the rest of the year.
Seventh-place Li Auto saw its seventh record month in a row. The carmaker achieved 40,424 registrations thanks to positive results across its line-up. In eighth, Changan also managed an excellent month thanks to the success of the Lumin and the Deepal S7 SUV.
Another best-performance in the month was Geely in ninth with 38,665 units. This was thanks to strong results across the board, including the Panda Mini’s record results as well as the Galaxy L7’s 9,336 units. Meanwhile, 14th-place Volvo had a more muted month with just 21,332 registrations.
Audi achieved a new best for 2023, with 25,577 registrations. However, BMW scored an extra 18,000 units in the same period, placing it in fifth. The reason for this difference between the two German marques is volume.
While Audi has the Q4 e-Tron and Q8 e-Tron as its volume models, BMW offers twice the number of vehicles. This includes the iX1, iX3, i4, iX, and the i3. Even without a star player like the Q4 e-Tron, BMW’s combination of models is enough to outsell Audi. In order to offer stronger competition, the VW Group brand needs to roll out the A6 e-Tron and Q6 e-Tron soon.
Xpeng took 15th following its best-ever result of 20,002 registrations. The company saw the G6 shine, while the bigger G9 also performed well. The Chinese startup will be hoping to post more consistent results soon. Leapmotor also continued its high-score streak thanks to the success of its C11 SUV. The brand scored its third record score in a row with 18,269 units registered.
Race for third
In the year-to-date brand table, BYD remained well ahead of Tesla. The two makes together were responsible for more than a third of the global EV market. Below, there could be an interesting race for third, with GAC Aion reporting a slower October.
This allowed BMW to gain ground, with only 13,000 units now separating the two. While the German brand will be hoping this trend continues, third is still a tall order, with its last podium presence achieved back in 2016.
In seventh, Mercedes-Benz could be pressured in December by a rising Li Auto. The Chinese startup has broken its records every single month of the year, so it could end up passing the German brand towards the very end of 2023. Elsewhere, Kia surpassed its stablemate Hyundai to take 13th, and Nio climbed to 17th, surpassing Ford.
VW Group faces Geely-Volvo
Looking at registrations with brands gathered under manufacturing groups, BYD took hold of 22.1% of the global EV market. Meanwhile, Tesla managed a 13.4% share. Third place went to VW Group (7.3%), which kept a good distance ahead of Geely–Volvo (6.7%) in fourth.
The Chinese conglomerate is unlikely to take third from the German OEM this close to the end of the year. However, 2024 is likely to feature an exciting race between the two companies as they try to line up behind Tesla and BYD.
In fifth, SAIC (5.5%) saw a reversal of fortunes from previously falling shares. But this was not the case for Stellantis, which sat in sixth as its share shrank to 4.4%. In seventh, BMW Group (4.1%) held its position, even gaining ground over GAC (4%) in eighth and Hyundai Motor Group (3.9%) in ninth.
Tesla trumps BEV table
Looking just at BEVs, Tesla remained in front with a 19.3% share across the first 10 months of the year. The US carmaker still has a comfortable lead over BYD (16.3%), making it unlikely that the Chinese company will take the lead in the final stages of the race.
This looks set to change next year, however, as BYD’s crowning becomes simply a matter of time. This is unlikely to happen in the first quarter, as China’s market will slow due to the festive period, resulting in fewer sales for BYD. Instead, the second quarter will likely see the Chinese carmaker surpass Tesla.
In third, VW Group (7.8%) maintained space between itself and SAIC (7.6%). An entertaining race can be expected between the two across the remainder of the year. In fifth, Geely-Volvo’s share surged (6.2%) thanks to strong results