Close
Close
The Smart #3 is the second model launched by the carmaker in its new era. Can it start a trend of budget-friendly, yet premium battery-electric vehicles (BEVs)? Autovista Group (part of J.D. Power) experts analyse the model with Autovista24 special content editor Phil Curry.
Now owned by Mercedes-Benz and Geely, Smart is evolving away from its microcar roots and towards models with broader appeal. The new generation of vehicles are designed by the German carmaker, with engineering and development led by the Chinese brand.
Mercedes-Benz-assisted design offers a premium look and feel while Geely offers more advanced BEV technology. Both companies have knowledge of the European market, either as a domestic brand or through subsidiaries like Volvo. This gives Smart a good opportunity to deliver in the region.
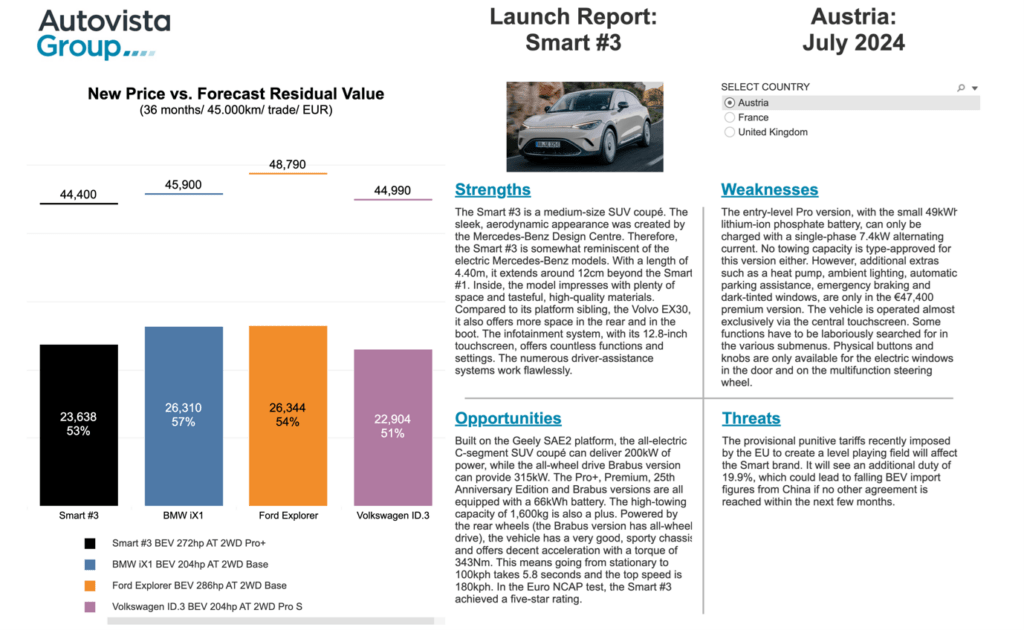
Autovista24’s latest Launch Report benchmarks the Smart #3 against its key rivals in Austria, France and the UK. This includes detailed analysis of its strengths, weaknesses, opportunities and threats. New price points are also outlined alongside forecast residual values.
Smart exterior
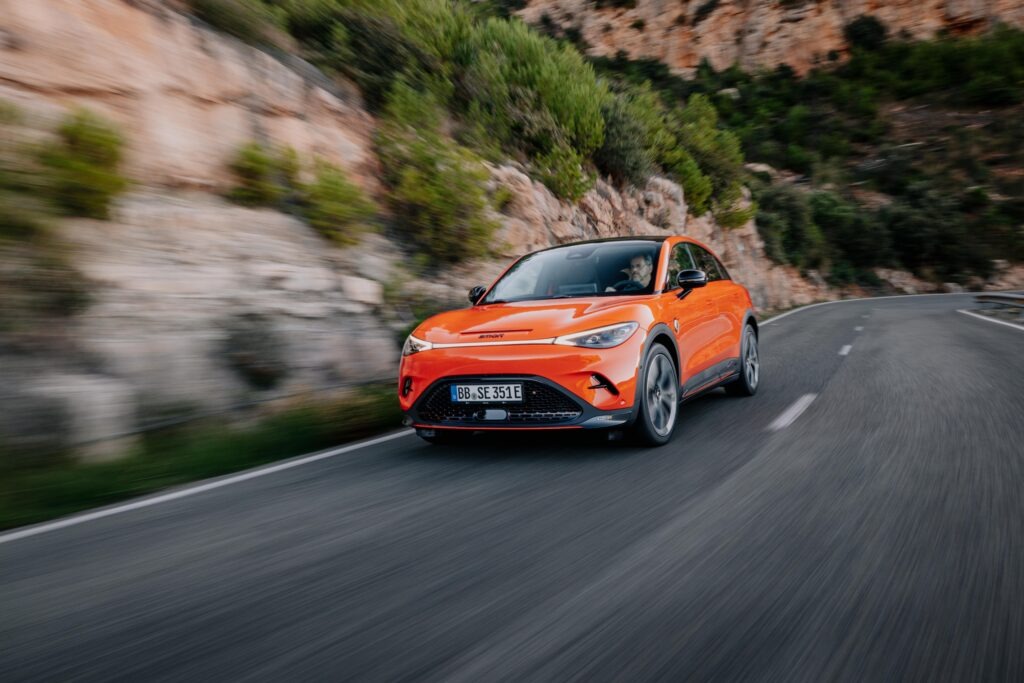
As the second model released under the joint ownership structure, Smart’s new design philosophy is clearly taking shape. The #3 is very similar in appearance to the #1, with LED headlights stretching into a light bar across the front of the vehicle.
The lower grill houses sensors for the advanced driver-assistance system, while the bonnet bulges above the wheel arches, channelling air. This aerodynamic design continues along the side, with channels to smooth airflow. Meanwhile, hidden door handles both reduce drag and add to a flush-looking exterior.
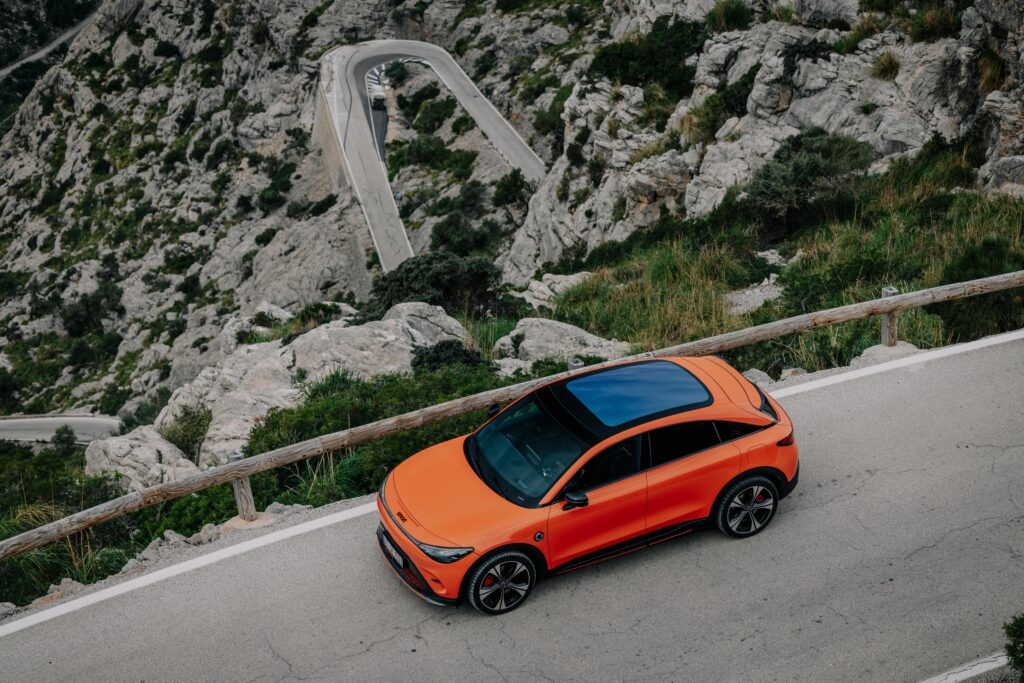
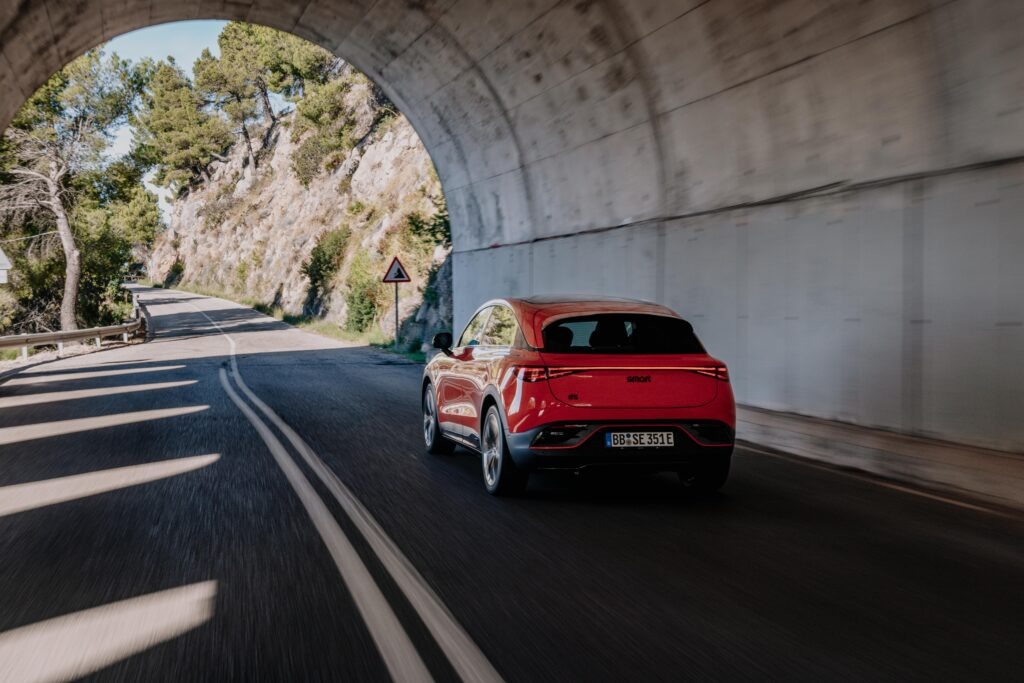
Smart is marketing the #3 as a coupé-SUV model. While it does feature a slightly sloping roofline, it is perhaps not as dramatic as regular coupés. However, the privacy-glass rear-quarter windows does continue the line set by the door windows into the rear of the car. This makes the model’s profile appear almost domed and futuristic.
Comfort and practicality
The cabin of the Smart #3 is pleasantly spacious. This is aided by the panoramic sunroof which floods the interior with natural light. Seating is comfortable, with the one-piece backrest offering good support, although the rear bench is quite firm.
Despite the coupé-esque roofline, the rear-passenger headroom is plentiful, even for tall adults. There is also plenty of legroom in the rear, even with the front seats positioned quite far back. The #3 can easily accommodate four adults as a result.
There is also plenty of storage available. The floating centre console features a large bottom shelf, with the armrest housing two cupholders, a dedicated phone slot, a charging area with two USB-C ports, and a large cubby. However, this does tend to open accidentally with the button easily caught by elbows.
The boot’s 370-litre capacity will easily hold three large suitcases, while this space expands to 1,160-litres with the rear seats folded almost flat. There is no flat loading area, with a small lip between the hatch and the boot floor.
There is a dual floor, allowing for charging cables or smaller items to be hidden away. Cables can also be stored in the frunk under the bonnet, which provides an additional 15-litres of space.
Infotainment issues
The Smart #3 features a 12.8-inch touchscreen infotainment system. Meanwhile, a smaller 9.2-inch screen containing detailed driver information is located behind the steering wheel. There is also a head-up display available in certain versions of the car.
As part of the General Safety Regulation 2 legislation passed by the European Commission, the Smart #3 features safety-related systems. This includes rear-view and blind-spot cameras, intelligent speed assistance and driver fatigue alerts. These last two systems are quite sensitive in the #3, providing audible notifications at the slightest infraction.
However, a screen behind the steering wheel sets the BEV apart from its platform sibling, the Volvo EX30. With immediately accessible information, the fatigue warning system is not repeatedly activated by the driver checking the centre screen.
As with many new models, most of the #3’s controls are located within menus and apps on the central touchscreen. This includes climate control, energy usage and driving modes, audio selection and volume.
There are shortcut touch-based buttons below the screen for select systems. However, basic audio controls only exist on the steering wheel, with no physical volume dial for the passenger. As many controls are buried in menus, it is difficult for the driver to switch functions off, adjust regenerative braking, or change radio stations when the vehicle is in motion.
The driving experience
On the road, the Smart #3 performs well for a vehicle of its size and weight. The suspension is medium-to-firm, soaking up bumps and keeping the 4.4-metre-long body steady. It does tend to wallow in sharper corners if taken at speed but corrects itself well.
The steering is precise and smooth, although there is a bit of vagueness at times, especially when cornering at higher speeds. It can feel like there is a lack of front-end grip when steering. This may be a consequence of the rear-wheel drive, with all-wheel drive only available in the performance Brabus version.
A 49kWh lithium-ion phosphate (LFP) battery is available on the entry-level Pro version, providing 325km of range (WLTP). All other versions get a 66kWh lithium nickel cobalt manganese (NCM) battery, providing up to 455km range (WLTP). Charging from 10% to 80% takes around 30 minutes with 150kW on the larger battery unit.
View the Autovista Group dashboard, which benchmarks the Smart #3 in Austria, France and the UK. The interactive dashboard presents new prices, forecast residual values, and SWOT (strengths, weaknesses, opportunities, and threats) analysis.
This content is brought to you by Autovista24.