Article Type: insights

Record EV sales as US new-car market growth continues

Driven by record electric vehicle (EV) sales, US new-car deliveries are expected to marginally increase in the country during September, continuing an upward trend. However, the overall picture is far from straightforward. In its latest forecast, J.D. Power unpicks the data.

Total new-vehicle sales in the US, including retail and non-retail transactions, are projected to reach 1,232,200 in September. This marks a 0.1% year-on-year increase according to the latest forecast from JD Power.

September 2025 has 24 selling days, one more than the same month last year. Comparing the same sales volume, without adjusting for the number of selling days, translates to an increase of 4.5% from 2024.

The seasonally adjusted annualised rate (SAAR) for total new-vehicle sales is expected to be 16.2 million units, up 0.3 million units from September 2024.

New-vehicle retail sales are projected to reach 1,031,400 in September, a year-on-year upswing of 0.4%. Comparing the same sales volume, without adjusting for the number of selling days, translates to an increase of 4.8% from 2024.

Strong demand and EV growth

‘In aggregate, September sales results point to another month of strong demand for new vehicles,’ said Thomas King, president of the data and analytics division at J.D. Power. ‘However, as has been the case for the past few months, assessing the health of the industry requires a closer look at the underlying market dynamics.

‘The biggest driver of September’s strong sales pace is temporarily inflated demand for electric vehicles. The federal EV tax credit expires at the end of the month, which is causing many shoppers to accelerate their purchase.’

The electric vehicle (EV) retail share is expected to reach 12.2% in September. This is an increase of 2.6 percentage points (pp) compared with 12 months ago. In total, this equates to a 27.5% boost in EV sales, selling day-adjusted, from one year previous.

‘The second key driver is affordability,’ added King, ‘although again, the EV dynamic means aggregate results need careful evaluation. In totality, average vehicle prices continue to rise, discounts remain low and monthly finance payments are at record highs, all of which affects the overall sales pace.’

New-vehicle price increases

The average new-vehicle retail transaction price in September is expected to reach $45,795 (€39,087), up $1,310, or 2.9% from September 2024. The average manufacturer incentive per vehicle is on track to reach $3,116, an increase of just $24 from August, and a decrease of $3 from a year ago.

Expressed as a percentage of the manufacturer’s suggested retail price (MSRP), incentive spending is at 6.1%, a decrease of 0.2 pp compared with one year ago. Average monthly finance payments are on track to reach $756, an increase of $21 from September 2024, and the highest on record for that month.

In response, more buyers are opting for extended 84-month loan terms, which are expected to account for 11.0% of finance sales in September. This is the second-highest level on record for the month.

‘The decline in manufacturer incentive spending to just 6.1% of MSRP is notable, but more notable are the limited discounts offered on non-EVs,’ confirmed King. ‘Incentives as a percentage of MSRP for non-EVs fell to just 4.8% of MSRP in September, down 0.8pp from a year ago.

‘Collectively, these pricing dynamics are helping manufacturers preserve profitability amid tariff related cost pressure, but at the expense of higher sales volumes. Nevertheless, there are some positives for new-vehicle demand, most notably lower interest rates, stronger used-vehicle prices and improved loan availability.’

The average interest rate for new-vehicle loans in September is 6.51%, a decrease of 25 basis points (one basis point is equal to 0.01%) from 12 months previous.

Used-vehicle price rises

‘The average used-vehicle price is trending towards $29,668, up $739 from a year ago,’ said King. ‘This reflects the combination of reduced supply of recent model year used vehicles, due to lower new-vehicle production during the pandemic, fewer lease maturities and manufacturers moderating discounts.’

Rising used-vehicle prices are benefiting new-car buyers, with average trade-in equity climbing $534 year on year in September to $8,430. However, that gain is partly offset by larger outstanding loan balances on vehicles being traded in. As a result, the share of new-vehicle buyers facing negative equity is projected to hit 25.9%, up 1.5pp from September 2024.

‘Access to new-vehicle loans for buyers with weaker credit also appears to be improving. The percentage of buyers with sub 650 FICO scores is trending towards 14%, up 3.1pp from last year and the highest level for September since 2016 at 14.9%,’ King affirmed 

‘The stable sales pace, combined with elevated average transaction prices mean consumers are on track to spend nearly $45 billion on new vehicles this month, 8.5% higher than a year ago and the second highest on record for the month of September.

‘Total retailer profit per unit, which includes vehicle gross plus finance and insurance income, is expected to be $2,240, up $12 from September 2024 and up $79 from August 2025. Total aggregate retailer profit from new-vehicle sales for this month is projected to be $2.2 billion, up 6% from September 2024,’ added King.

EV factor set to impact October results

Looking ahead to October, EVs are expected to remain a defining factor in the US new-car market. However their impact on overall sales is likely to change direction.

‘A very significant decline in EV sales is expected for October,’ reflecting both the effect of the federal EV tax credit expiring and the start of payback from all the EV purchases that were accelerated into the summer,’ highlighted King. ‘The net effect will be heavily influenced by the extent to which manufacturers attempt to offset the loss of the federal EV tax credit, if at all.’

‘October sales will also be affected by manufacturers’ pricing and incentive decisions on non-EVs. The current low level of non-EV discounting provides plenty of potential for manufacturers to escalate incentives to bolster demand. However, tariff-related cost pressure remains significant, meaning the current pricing and incentive environment is likely to persist for much of the final quarter of the year,’ He concluded.

Sales details

  • Fleet sales are expected to total 200,819 units in September, down 1.5% from September 2024. Fleet volume is expected to account for 16.3% of total light-vehicle sales, down 0.3ppfrom a year ago.
  • Internal combustion engine vehicles are projected to account for 71.7% of new-vehicle retail sales, a decrease of 4.9pp from a year ago. Plug-in hybrids (PHEV) are on pace to make up 2.6% of sales, up 0.5pp from September 2024, while EVs are expected to account for 12.2% of sales, up 2.pp, and full hybrids (HEVs) are expected to account for 12.4% of new-vehicle retail sales, up 0.7pp.
  • US final assembly vehicles are expected to make up 55% of sales in September, up 4.1pp from a year ago.
  • Trucks and SUVs are on pace to account for 82.1% of new-vehicle retail sales, up 1.6pp from September 2024.

Retail details

  • Retail inventory levels are currently at 2.21 million units, a 17.5% increase from September 2024.
  • The industry’s inventory days of supply is 60 days in September, up from 54 days a year ago.
  • The average new-vehicle retail transaction price in September is expected to reach $45,795, up $1,310 from September 2024. Transaction price as a percentage of MSRP fell to 89.2%, down 0.5pp from a year ago.
  • Retail buyers are on pace to spend $45 billion on new vehicles, up $3.5 billion from September 2024.
  • Average incentive spending per unit in September is expected to reach $3,116, down $3 from September 2024. Incentive spending as a percentage of the average MSRP is expected to decrease to 6.1%, down 0.2pp from September 2024.
  • Average incentive spending per unit on trucks and SUVs in September is expected to be $3,244, down $54 from a year ago, while the average spending on cars is expected to be $2,492, up $167 from a year ago.
  • Leasing is expected to account for 23.9% of sales this month, up 0.6pp from a year ago.

Dealer details

  • The average time a new vehicle remains in the dealer’s possession before sale is expected to be 50 days in September, up from 49 days a year ago.
  • 30.8% of vehicles sold in less than 10 days in September, down 1.5pp from a year ago.
  • Average monthly finance payments are on pace to be $756, up $21 from September 2024. The average interest rate for new-vehicle loans is expected to be 6.51%, down 0.25pp from a year ago.
  • So far in September, average used-vehicle retail prices are $29,668, up $739 from a year ago. Trade-in equity is trending towards $8,430, which is up $534 from a year ago.
  • 25.9% of trade-ins are expected to carry negative equity this month, an increase of 1.5pp from September 2024.
  • Finance loans with terms greater than or equal to 84 months are expected to reach 11.0% of finance sales this month, up 1.5pp from September 2024.

The US EV outlook

‘As the final month of the federal EV incentive draws to a close, EVs are on pace to exceed 12% in the US for the first time ever,’ confirmed Tyson Jominy, senior vice president of data and analytics at JD Power. ‘While this would mark another record, the absence of a significant end-of-incentive surge underscores the underlying softness in consumer demand for the technology.

‘Inventory remains the key storyline as the quarter winds down. Barring a significant final sales week, more than 163,000 EVs remain on dealer lots, with approximately 100,000 of those from legacy automakers. The looming question is, “What happens to this inventory in the final quarter of 2025?” With federal support expiring, manufacturers may be compelled to absorb some or all the lost value to maintain momentum.

‘In the context of the recently released J.D. Power 2025 U.S. Automotive Brand Loyalty Study, there is a bright spot. EVs from franchised automakers are showing 55% nameplate loyalty, outperforming the industry average by 6pp. This suggests that while the broader market may be hesitant, brand equity is still resonating with EV buyers.

‘PHEVs also affected by the tax credit changes, are seeing less disruption. Their 2.6% retail share is 0.5pp below the all-time high set in December 2024, indicating a more stable demand curve.

‘Meanwhile, HEVs continue to gain traction. Retail share stands at 13.8%, up 2.1pp from September 2024 and holding near record highs. This growth underscores the segment’s resilience, even as consumers adjust to the phase-out of the federal incentive for electric vehicles and plug-in hybrids,’ concluded Jominy.

Can battery health certificates answer big used-EV questions?

Battery certificates and state of health (SOH) checks are at the forefront of a growing used electric vehicle (EV) market. How will they help answer the big used-EV questions from retailers and buyers? Tom Hooker, Autovista24 journalist, investigates the subject.

For the modern used-car buyer, it has become commonplace to access a plethora of information about any model online. This research can be done through portals or directly from retailers. Yet, the sector is in the midst of a big shift.

As battery-electric vehicle (BEV) and plug-in hybrid (PHEV) registrations increase across new-car markets, the supply of used EVs rises. This presents a new challenge for retailers. They need to convince consumers to buy EVs, while also learning how to accurately price them and make profits.

Battery SOH checks could be a solution to this challenge. They can provide customers with peace of mind while revealing a car’s history, value, and selling potential to retailers.

‘EVs are not degrading the same way as petrol or diesel vehicles. Mileage is not sufficient to have a clear view of the current health of an EV. That means for the exact same mileage, you can buy two EVs with a very different fate,’ BIB batteries CEO Pierre-Amans Lapeyre told Autovista24.

‘Knowing the SOH, you can have the history, the current value and the future. It gives you what should be the real residual value of the vehicle. I would much rather have the SOH of an EV than know its mileage, because from what we have seen on the market, two vehicles with the exact same SOH could have a completely different mileage,’ he added.

Fostering used-EV uncertainty

‘Nowadays, you can advertise a car with photographs, with descriptions, and with diagnostics. Everybody can do that. So, I think as an industry we have solved the problem fairly well with the technology available,’ outlined Roland Gagel, CARA board member at the Used Vehicle Retail Summit.

Roland Gagel, CARA board member

‘We see that this market is very rational, buyers are looking for transparent offers and want to see pictures and descriptions,’ he added. Gagel then explained that BEVs are a different prospect, with the most important aspect of the car being the battery.

He highlighted that current advertisements of used EVs are not clear enough and can foster uncertainty among potential buyers. Late entrants to the EV space could be particularly impacted.

Convincing late adopters

Gagel explained that when buying or selling a three-year-old petrol or diesel car at 70,000km, you can assume it has a well-maintained engine. This means you can easily drive the car for ten more years.

However, the buyer confidence around longevity is very different for electric devices. Mobile phones are one such example. ‘We are not talking about the early adopters, the people who already wanted to have an EV five years ago,’ said Gagel.

‘We are talking about the people who now start to think about it and will maybe finally be convinced. They know that after four or five years, their mobile phone is dead, and the battery is not okay. So, what does that mean for my three or four-year-old EV?

‘I am maybe going to want to resell it after eight or nine years and want to buy another one. So, we have this problem, which is very often the range, because in the end, that is what the driver feels.’

There are tools available to help drivers understand more about the lifespan and health of their EV. Most models now show average energy consumption on their infotainment screen. This can be divided by the total energy storage of the battery, which provides the real, approximate range of the vehicle.

So, customers can be provided with a wealth of information on the condition of a used EV. However, how this information is used and shared by the retailer makes all the difference.

Limited certificate usage

Gagel showed an example of an online used-car portal from a remarketing company. Here, the price of a BEV was marked down by €2,000 without any information on why the model’s price had been reduced.

Additionally, Gagel searched the mobile.de website for a popular German BEV. With certain parameters selected, he got 160 results. Out of this, 50 had a battery SOH certificate. However, in most cases, the actual SOH value could not be found in the description.

‘Imagine you sell a car without mileage, and the buyer calls the dealer to know the mileage. What do you do with such an advertiser? Just skip it and go to the next,’ he commented.

Gagel then went on to show the carmaker’s own website for its used cars. He selected two of their BEV models, which gave him 2,600 search results. However, only 40 of these models had a battery certificate shown on the portal. Lapeyre also noted the lack of SOH certificates on online adverts.

‘There are a lot of studies about the fear of individuals buying EVs, they do not trust the lifespan of the battery. I would say around 50% of dealers today put SOH on their vehicle adverts. You will not sell your EV if you do not have this information,’ he stated.

Regulatory impacts

The introduction of new regulations could also help improve the clarity between used EV sellers and potential customers. SOH checks would be a pivotal technology in achieving this clarity.

For example, the upcoming Euro 7 regulations state that passenger cars must retain at least 80% of their original battery capacity after 5 years or 100,000 km, whichever comes first. Then, after 8 years or 160,000 km, the battery capacity must be at least 72%.

Furthermore, the regulation states that EVs must have SOH monitors onboard. Data from these monitors must be displayed to users, retrievable from diagnostics, and included in the vehicle’s Environmental Vehicle Passport.

‘The regulation that comes with Euro 7 and the battery passport will foster the transparency of the SOH. The regulation will start in 2027, so in the used-car sector, you will see it from 2028 with the first short-term rentals,’ noted Gagel.

‘But I think the real effect will come in 2029 and 2030. So, we have five years to go to sell used cars without the battery pass and Euro 7,’ he added.

Increasing consumer transparency

‘There is an unsourced fear about the end of warranty for EVs. When they end, people are freaked out, and it is not rational,’ said Lapeyre.

According to a 2024 McKinsey & Company survey, 31% percent of prospective EV buyers say they are likely or very likely to consider a used EV for their next vehicle purchase. For those EV sceptics, 49% were concerned about unclear battery degradation.

So, the industry cannot wait another five years to start improving the used EV sales experience and calming EV concerns.

‘The key point for us is how to get this into a B2C sale and how to show the positive part of the batteries. How do we convey this message? How can we train the salespeople to sell this off to the consumer? That will be very important for the industry,’ said Gagel.

‘On the dealership side, I think they need to provide their clients with battery certificates. They need to train their salespeople so that they can show and express the value of an EV to their clients,’ commented Lapeyre.

‘What can you do as an industry? For me, it is very clear, used-car offers need to become more transparent. They are not transparent today,’ said Gagel.

‘In the end, if the buyers do not have clear information about the battery, they will assume there is a problem. The clearer we are and the more we are pushing in the direction of transparency, the more likely it will be that BEVs will recover from their residual values.

‘It is not just good to measure the vehicle, but we have to make sure it gets into the vehicle description, so the customer knows we have good cars to sell,’ concluded Gagel.

Can European car sales survive economic and political uncertainty?

Have forecasts for European light-vehicle sales retained their marginal growth amid economic and political uncertainty? Neil King, head of forecasting at EV Volumes, reviews the latest data with Autovista24 journalist Tom Hooker.

EV Volumes forecasts that Western and Central European light-vehicle sales, made up of passenger cars and light-commercial vehicles (LCVs), will decline by 0.3% year-on-year in 2025.

This is a change from the March 2025 outlook, which projected a 0.7% growth. It is also below the 1.7% increase recorded in 2024, and significantly behind the 14% registrations growth in 2023.

A total of 14.91 million new light vehicles are expected to hit the road this year, a drop of around 148,800 units from the March forecast. Moreover, this figure is still well below the 18.04 million light vehicles registered in 2019, before the COVID-19 pandemic and supply-chain crisis.

EV Volumes does not expect the European market to return to that volume level within the current forecast period, which stretches to 2040. A 1.9% growth in European light-vehicle sales is projected in 2026, down from the March projection of a 2.1% increase. This improvement depends on a complex mix of regulatory and economic factors.

Current European uncertainty

There is uncertainty surrounding the impact of changing goods tariffs, developments relating to the war in Ukraine, and increasing tensions in the Middle East. Furthermore, EV Volumes assumes that a rising risk of rising inflation, oil prices, and energy costs will lead to weaker private consumption across the region.

Additionally, the OECD’s June 2025 economic outlook predicts that GDP in the Euro area will grow by only 1% in 2025. Due to weaker goods exports to the US and a struggling services sector, registrations of LCVs are already being affected by trade frictions and tariffs. Passenger car sales are expected to follow suit.

Meeting the lower CO2 emissions targets and circularity requirements mandated by the European Commission will also necessitate a major increase in electric vehicle (EV) sales.

This could trigger a price war, supported by lower lithium costs. Carmakers may also restrict the supply of internal combustion engine (ICE) vehicles to avoid costly emissions fines.

Ultimately, the outcome will depend on how OEMs balance short-term profit with long-term compliance and market shifts. Considering these developments, has the European EV outlook changed?

European EV sales growth

European EV sales of light vehicles are forecasted to grow by 23.1% year-on-year in 2025 to 3.77 million units. This is up from the 3.53 million sales and 15.1% volume increase projected in March. It also marks a turnaround from the market’s 2.4% decline in 2024.

EVs are expected to represent 25.3% of total European light-vehicle sales this year, a positive revision from the 23.4% share forecast in March. Furthermore, it is a notable improvement from the 20.5% EV market hold in 2024 and the 21.3% share in 2023.

Driven by new model launches, lower prices, and emissions targets, EV Volumes forecasts that EVs will reach a 29.2% share of European light-vehicle sales in 2026. This is significantly higher than the 26.4% market hold predicted in March.

In 2027, the EV share is expected to rise to 35.4%. Again, this is up from the previous forecast’s projected share of 33.3%.

Battery-electric vehicle (BEV) volumes are forecast to grow by 20.9% year-on-year in 2025, accounting for 67.4% of the 2025 EV mix. Meanwhile, plug-in hybrid vehicle (PHEV) sales are expected to increase by 27.8%.

Looking further forward, EVs are expected to capture 62.9% of European light-vehicle sales in 2030, up from the March forecast of a 60.5% share. This market hold is predicted to increase to 93.5% in 2035, up from 93.1% in the previous outlook. In 2040, EVs are projected to account for 99.4% of the total European market.

The forecast for 2035 and beyond includes some tolerance for timing interpretations of the ICE new-car sales ban and allows for exemptions for vehicles that may be deemed unsuitable for full electrification.

Regulations affecting European EVs

In March 2025, the European Commission unveiled the Industrial Action Plan for the European Automotive Sector. It proposed measures to support the industry’s competitiveness and transition to zero-emission mobility.

One of these was the relaxation of the 2025 CO2 emissions targets for cars and vans, which was officially approved in May 2025. More specifically, the compliance period has been extended from one to three years, providing manufacturers with greater flexibility to avoid fines.

However, some measures were not included in the Action Plan, such as the discussion surrounding the potential exclusion of PHEVs from the 2035 new-car ICE ban.

Consequently, EV Volumes’ forecast for BEV adoption anticipates moderate share growth in 2025 and 2026.

Then, a more significant increase is expected in 2027, as manufacturers strive to meet the average CO2 emissions targets of 93.6 g/km for cars and 153.9 g/km for LCVs over the three-year period.

To meet these targets, EV Volumes calculated that the BEV share of EU light vehicles needs to average at least 20% between 2025 and 2027. This means a 20.5% share is required for passenger cars and an 18% market hold is needed for LCVs.

Yet OEMs are not forecast to achieve this 20% average for all light vehicles by 2027 without additional EU-wide stimulus. This is mainly due to slower LCV electrification. Instead, EV Volumes anticipates that the targets will be met over the 2025 to 2028 period.

This forecast could be revised if further exemptions and lower targets are put in place. New EU-wide or national incentives could also alter EV share projections.

Incentives altering European projections?

An example of these incentives can be found in Italy, where €597 million in funding for a scrappage scheme has been announced, as reported by Il Sore 24 Ore.

Meanwhile, Germany is considering the reintroduction of BEV incentives in 2025, after subsidies stopped at the end of 2023. However, the implementation of new funding may be delayed due to economic conditions.

Furthermore, more affordable BEVs are expected to enter Europe. Leading Chinese OEMs like BYD are also planning to expand in the region.

On the other hand, PHEV registrations are exceeding expectations. This was the major factor in June’s upward revision for 2025 EV sales. The additional volume is driven by the eased CO2 targets, expanded PHEV offerings from both European and Chinese players, and delayed launches of low-cost BEVs.

Additionally, the UK’s ban on new petrol and diesel models from 2030 still allows all hybrid types to be sold until 2035.

The country’s government has also announced the return of EV incentives from 16 July. The scheme will reduce the cost of some new EVs by up to £3,750 under grants. This signals a change in policy for the UK and will impact future forecasts.

Varied European country outlooks

The current EV Volumes outlook sees the UK registering 702,911 EVs in 2025, a sharp increase of just over 131,000 units compared to its 2024 total. The powertrain grouping is expected to take a 39.6% market share in 2025, up from 32.5% in the previous year.

Italy will hope its new incentives can help to boost EV adoption, which has been sluggish compared to other major light-vehicle markets. EVs are forecast to represent 11.6% of the market in 2025, up from 8.7% in 2024. Sales are projected to increase by just over 44,000 units to 166,104 registrations.

An effective implementation of subsidies can be seen in Spain, which has helped BEV and PHEV volumes to soar. The reintroduction of the incentive scheme includes grants, tax breaks, and support for charging.

In 2025, the country is projected to see a year-on-year gain of over 80,000 units to 201,801 EV registrations. The EV share is expected to rise from 13.6% in 2024 to 21.9% this year.

Even without incentives, EV sales in Germany are on track to bounce back to 2022 levels. The powertrain grouping is forecast to record 829,398 sales in 2025, an increase of over 246,000 units compared to last year. EVs are expected to account for 30.2% of the total light-vehicle market, up from 21.4%.

On the other hand, France is currently suffering a decline in EV volumes. This is reflected in the current outlook, which sees it dropping nearly 5,600 sales year on year to 456,953 units. However, this is largely due to the wider light-vehicle market declining as the EV share is predicted to grow to 32.3% from 31.4% in 2024.

LCV EV uptake lags

LCVs still lag in EV uptake. A registrations growth of 43.7% growth in 2023 was promising, especially compared to a 16.2% improvement for passenger cars. However, both the volume and share of electric LCVs declined more than passenger cars in 2024.

High costs relative to diesel models and limited driving range hindered adoption. Nonetheless, new models, such as the Ford Transit, Renault Trafic, VW Transporter and updated Stellantis electric vans, are expected to drive demand.

EV Volumes forecasts that the EV share of LCVs will rise from 5.4% in 2024 to 10% in 2025. Its market hold is projected to increase to 13.5% in 2026 and reach 52.1% by 2030.

While the new-car ICE ban will accelerate the shift to electric, EV Volumes anticipates a 92.3% EV share for LCVs in 2035, compared to 93.7% for passenger cars. This is expected to rise to 99.1% in 2040.

The role of e-fuels and other CO2-neutral ICE technologies is expected to remain limited, depending largely on national tax policies. EV Volumes also expects the deployment of hydrogen fuel-cell vehicles to be limited in light commercial vehicles, with their share peaking at just 0.01%.

Is global turmoil a threat to future EV sales?

US tariff uncertainty remains, conflicts continue, and economic headwinds prevail. These are just some of the factors affecting global light-vehicle sales outlooks. But how will they impact electric vehicle (EV) figures? Neil King, head of forecasting at EV Volumes, reviews his projections with Autovista24 journalist Tom Hooker.

The global light-vehicle market, made up of passenger cars and light-commercial vehicles (LCV), is forecast to improve by a modest 1.1% in 2025. EV Volumes expects over 90.15 million units to be registered this year.

This is down from its previous 1.2% growth prediction made in an interim report in April. The figure is also a 0.7 percentage point (pp) drop from its March forecast. This equates to a loss of around 40,000 units from April’s report.

This is due to continued subdued order intake in Europe, caused by high interest rates and elevated living costs.

The downturn also takes into account US automotive tariffs, which were announced in March, as well as ongoing uncertainty surrounding broader trade duties since April, growing instability in the Middle East, and the continued Russia-Ukraine conflict.

Global EV growth continues

Meanwhile, Global EV deliveries, which combine battery-electric vehicles (BEVs) and plug-in hybrids (PHEVs), are forecast to rise by 19.8% in 2025 to 21.29 million units. This represents an increasingly positive outlook, with a 19.2% improvement forecasted in April.

However, this improvement would still be below 2024’s 25.3% increase. This was, however, with a lower total volume of 17.78 million EVs registered.

This year’s double-digit global EV growth is expected to come despite some governments phasing out purchase incentives and tax breaks amid mounting national debt, particularly in Europe. Non-Triad markets and robust PHEV demand in Europe have held up the forecast, offsetting downgrades in China and North America.

While EVs took a 19.9% share of the global light-vehicle market in 2024, the powertrain grouping is predicted to capture 23.6% of overall sales this year. This figure is stable from April’s forecast.

BEVs are expected to take a 65.1% share of the light vehicle EV market in 2025, with a year-on-year delivery improvement of 22.9%. PHEVs are forecast to see slower growth of 14.3% giving them a 34.9% share.

This is a drop from the 36.6% PHEV share in 2024, when the powertrain outpaced BEVs in terms of growth. The former enjoyed a 55.1% surge in volumes compared to BEVs’ 12.8% improvement.

Longer-term forecasts

Looking further forward, the global EV share is forecast to reach 26.4% in 2026, before improving to 42.2% in 2030, reaching 64.2% in 2035, and 83.1% in 2040. However, budget pressures and policy shifts may threaten investment in incentives and charging infrastructure, which could impact the outlook.

The global volume of EVs is set to rise from 21.29 million units in 2025 to 40.15 million registrations in 2030. A total of 64.02 million deliveries are expected in 2035, increasing to 86.7 million units in 2040. This figure is almost five times the number of EV sales recorded in 2024. 

Annual traction battery demand is forecast to increase from just under 0.87 TWh in 2024 to around 5.77 TWh in 2040. The latter is nearly seven times the actual annual demand seen last year.

EV Volumes also forecasts that global battery demand for light vehicles will surpass 1TWh in 2025.

This is driven by the quest for longer electric ranges in all vehicle segments. Yet, the trend for larger batteries is slowing as they gain in efficiency. Furthermore, lower costs facilitate the electrification of smaller vehicles, where profit margins are tighter.

The number of EVs in operation is increasing rapidly. However, their share of the overall light-vehicle fleet is developing with a considerable delay.

There are 1.33 billion light vehicles on the road today, with plug-ins accounting for just 4.1% of this total. EV Volumes predicts it will take until 2043 for more than half of the global fleet to be electric. This is calculated using their current forecast for EV growth, which assumes normal scrappage rates.

Europe set for decline?

In Western and Central Europe, EV Volumes expects that light-vehicle sales will decline by 0.3% year-on-year in 2025. This is lower than their interim April 2025 forecast, which projected a 0.1% increase. It is also a significant drop from the predicted growth of just under 0.7% in their March forecast.

A total of 14.91 million light vehicles are expected to take to European roads in 2025. This is slightly down from April’s forecast of 14.99 million units and still well below the 18.04 million light vehicles registered in 2019.

This downward revision comes as uncertainty persists regarding the impact of changing goods tariffs, developments in Ukraine, and escalating tensions in the Middle East. EV Volumes also assumes a growing risk of rising inflation, oil prices, and energy costs, which will lead to weaker private consumption across the region.

Furthermore, the OECD’s June 2025 economic outlook predicts that GDP in the Euro area will grow by only 1% in 2025.

Due to weaker goods exports to the USA and a struggling services sector, EV Volumes sees registrations of LCVs already being affected by trade frictions and tariffs. Passenger-car sales are expected to follow suit.

European regulatory and economic factors

Moreover, EV Volumes does not expect the European market to return to its 2019 volume level within the current forecast horizon, which stretches to 2040. In 2026, a 1.9% growth in European light-vehicle sales is projected. This hinges on a complex combination of regulatory and economic factors.

Meeting the required lower CO2 emissions targets and circularity requirements mandated by the European Commission will necessitate a major increase in EV sales. This could trigger a price war, supported by lower lithium costs. OEMs may also restrict the supply of internal combustion engine (ICE) vehicles to avoid costly emissions fines.

On a positive note, Italy has announced €597 million in funding for a scrappage scheme, as reported by Il Sore 24 Ore. Meanwhile, Germany is considering the reintroduction of BEV incentives in 2025, after subsidies stopped at the end of 2023. However, the implementation of new subsidies may be delayed due to economic conditions.

Furthermore, more affordable BEVs are expected to enter Europe. Leading Chinese OEMs like BYD are also expanding in the region.

On the other side of the EV market, PHEV registrations are exceeding expectations. This additional volume is driven by the eased CO2 targets, expanded PHEV offerings from both European and Chinese players, and delayed launches of low-cost BEVs.

Additionally, the UK’s ban on new petrol and diesel models from 2030 still allows all hybrid types to be sold until 2035. The country’s government recently announced the cost of some new EVs will soon be reduced by up to £3,750 under grants. This signals a change in policy.

Altered European EV forecast?

As a result of these factors, EV Volumes expects that European electric light-vehicle sales will grow by 22.8% year-on-year in 2025 to 3.77 million units. This is a notable increase from April’s forecast of 3.51 million registrations, translating to a year-on-year rise of 14.3%.

EVs are predicted to represent 25.3% of total light-vehicle sales this year, up from a 20.5% share in 2024. In the previous forecast, the increase was projected to be 23.4%.

Broken down, BEV volumes are forecast to grow by 20.6% year-on-year and account for 67.4% of the 2025 EV mix. Meanwhile, PHEV sales are expected to increase by 27.7%.

Driven by new model launches, lower prices, and stricter emissions targets, EV Volumes forecasts that EVs will reach a 29.2% share of European light-vehicle sales in 2026. Then, BEVs and PHEVs are expected to account for more than one in three registrations in 2027.

The EV share is then projected to rise to 62.9% in 2030, reaching 93.5% in 2035, and 99.4% in 2040. The forecast for 2035 and beyond includes some tolerance for timing interpretations of the ICE sales ban and allows for exemptions for vehicles that may be considered unsuitable for full electrification.

China boosts domestic production

Considering the current economic headwinds, China’s government has focused on boosting domestic automotive consumption. Additional support has been directed toward state-owned OEMs.

However, trade friction with the US has added uncertainty, and China’s economic growth in 2025 is expected to fall short of the 5% target.

The country’s scrappage scheme, which offers higher trade-in bonuses for EVs than for petrol vehicles, has supported the market’s strength alongside a favourable cost of ownership and increasingly competitive pricing.

After launching in April 2024, the program has been extended beyond the original January 2025 deadline, as reported by the International Council on Clean Transportation. However, it has been suspended in several cities, which could disproportionately reduce demand for EVs given their higher bonus levels, electrive reported.

A stable outlook?

Taking all these factors into account, EV Volumes maintained its 2025 Chinese light-vehicle market forecast of 26.7 million units, an improvement of 2.7% year-on-year.

EVs are forecast to represent 51.4% of all light-vehicle sales this year, up 7.1pp from its 2024 market share. This is then projected to increase to 72.8% in 2030, before growing to 88.3% in 2035, and 95.5% in 2040.

Chinese OEMs continue launching new PHEVs and extended-range electric vehicles (EREVs). Yet, BEVs are regaining momentum, bolstered by aggressive discounting initiated by BYD. As such, BEVs are forecast to account for 61.5% of EV sales in 2025 after reaching a 57.7% share of the EV market in 2024. This share will then grow to two thirds by 2030.

Forecast volumes in China are based on retail sales, not wholesales. This excludes exports and inventory build-up, which explains the differences from the typically higher wholesale-based figures published by other agencies.

Tariffs impact Northern America

The Northern American automotive market, which includes the US and Canada, is impacted by the 25% tariffs imposed by the US on imported vehicles.

To reduce the impact, there are adjustments for US parts content in Canadian and Mexican-built models, but even vehicles assembled in the US do not escape unscathed. This is because the tariffs still apply to non-US components.

Average new car prices in the US are expected to increase by 5% by the end of 2025, which in turn could reduce sales by 8%, according to J.D. Power representatives.

On a more positive note, a reimbursement scheme was implemented by the US government at the end of April, which offers OEMs tariff relief over two years. Carmakers assembling vehicles in the US can receive a credit worth up to 3.75% of the vehicle’s manufacturer’s suggested retail price. This then drops to 2.5% in year two.

So far, prices have largely held steady. However, discounting has weakened and an increase in vehicle demand referred to as the “pre-tariff bump” had already subsided by June.

Meanwhile, a Republican-backed Senate bill will see EV tax credits of up to $7,500 (€6,420) disappear by 30 September. This has led to carmakers urging buyers to take delivery of a new model by the deadline, according to Reuters. Any resulting pull-forward effect in 2025 is likely to be offset by weaker demand due to higher vehicle prices.

In Canada, funding for the iZEV programme ran out in January 2025, with BEV uptake falling and no replacement scheme announced.

Revising downward

Considering these developments, EV Volumes lowered its 2025 light-vehicle sales forecast for Northern America to 17.66 million units, a decline of 1% year on year. This would be a weak performance for the market after its 2.9% growth in 2024.

The long-term outlook has also been revised downward, by around 29,000 sales in 2026 and 65,000 units in 2027.

The combined BEV and PHEV share is now expected to fall from 10.2% in 2024 to 9.9% this year. In 2026, the EV market hold is projected to rise modestly to 11.1%. This is expected to be primarily supported by a more affordable Tesla model.

The EV share is then forecast to climb to 22.5% in 2030 and 41% in 2035. BEVs are PHEVs are predicted to make up 60.3% of the overall Northern American market in 2040, some distance below the expected global EV share of over 80%.

Non-triad outlook improves

In non-Triad markets, light-vehicle sales are expected to increase by 1.8% in 2025 to 30.88 million units.

This was an upward revision of 0.1pp from April, when the weaker global economic outlook, especially considering US trade tariffs, led EV Volumes to downgrade its growth projections. However, June’s forecast is still below the 2.3% improvement projected in the March forecast.

The EV share in non-Triad countries is forecast to reach 6.6% in 2025. This would be ahead of the 5.9% market hold projected in April’s outlook, and the 4.5% share recorded last year. Total electric light-vehicle sales are predicted to reach 2.03 million units this year, around 234,000 deliveries higher than the previous forecast.

This total would translate to an EV sales growth of 49.5% year on year, even higher than the 34.2% increase recorded in 2024. BEVs are forecast to see volumes rise by 43% in 2025, while PHEVs are projected to enjoy an even greater increase of 72.9%. In turn, the BEV share of the EV light-vehicle market is expected to drop from 78.5% to 75.2%.

EV subsidies implemented

Several factors may have influenced this upward revision and projection of strong growth. Firstly, Japan increased the budget for EV subsidies under the Clean Vehicle Energy Subsidy Programme in early 2025. Elsewhere, India cut import duties for premium EVs as part of a new manufacturing programme in June 2025, as written by Business Standard.

Indonesia introduced a VAT exemption for low-emission vehicles in January 2025 and a reduced VAT rate thereafter. Finally, in response to US tariffs, South Korea launched temporary stimulus measures, including financing support and higher EV subsidies, Reuters reported.

However, budget constraints driven by higher defence spending and macroeconomic concerns may limit future incentive schemes. The non-Triad EV share is projected to reach 16.8% in 2030, then 41.6% in 2035, and 76.7% in 2040. This means the region’s EV market generally lags the global adoption curve by about five years.

The regions and technology pushing public EV charging forward

The number of public electric vehicle (EV) charging points continues to grow, but which region and technology leads the way? Using the latest data from EV Volumes, Autovista24 editor Tom Geggus assesses the situation.

Charging infrastructure continues to grow across the world as EV adoption drives demand. But what is the best way to measure the volume of plug-in points currently available to the public?

Across 75 markets, EV Volumes tracks the number of locations where a certain connector type can be found. This surpasses a simple tally of station numbers, instead accounting for charger variety.

A station with two combined charging system (CCS) points counts as one location. Meanwhile, a charger offering one CCS and one CHAdeMO connection counts as two locations.

According to this classification, 3.85 million EV charging points were tallied by May 2025. This equated to an increase of 34.8% compared with the same point last year. However, this is slower than the 42.6% growth in May 2024 and far below the 81.8% recorded 12 months before that. There was an increase of 34.7% at the same point in 2022, but this was down from the 53.2% jump in May 2021.

Speedier charging?

While the rollout of public EV infrastructure might have slowed, not all technologies have developed at the same rate. Dividing charging speeds into three categories reveals some emerging trends.

some emerging trends.

The normal speed category includes type 1, 2 and 3 points, Tesla high-power wall connectors, and Chinese GB/T AC chargers. The power output in this category extends up to 24kW.

This grouping saw year-on-year growth of 71.8% in May 2023 and 58.3% in the same month last year. By May 2025, nearly 2.15 million normal-speed charging points were recorded across the 75 observed markets. This meant slower year-on-year growth of 23.4%.

The fast-charging category has followed a similar path. This grouping is made up of 22-60kW GB/T DC Chinese connectors as well as 50-350kW CHAdeMO and CCS plugs. By May this year, 1.69 million fast-charging points were tallied, up by 53% compared with the same point 12 months ago. This followed growth of 45.4% in May 2024 and 101.1% a year prior.

The ultra-fast category covers 250kW Tesla Superchargers and 350kW CCS plugs. The number of these points increased by 11.8% to 9,371 by May 2025. This grouping saw year-on-year growth of 27.1% by the same point in 2024 and 47.7% in May 2023.

Fast charging accelerates

While the ultrafast category has grown more slowly, EVs capable of charging at this speed remain in the minority. Additionally, these are often more premium models, outside of the mass market.

Meanwhile, the list of EVs capable of accessing fast charging infrastructure is far more expansive. Carmakers want to address concerns of longer plug-in times, introducing speedier charging capabilities more broadly as the technology advances.

This helps account for the fast-charging category seeing nearly double the growth of the normal grouping in May 2025. The technology also made up 44% of recorded public charging infrastructure, up by 5.3 percentage points (pp) from May 2024.

Most of this gain was at the expense of the normal speed grouping, which saw its share fall to 55.8%. At the same point last year, the technology made up 61% of all recorded plug-in points. This development follows the technological progression of EVs as they achieve faster charging speeds.

Meanwhile, the ultra-fast category shrank marginally by 0.1pp to 0.2%. This is likely due to the technology’s greater exclusivity, higher costs and greater demands on the grid. But have these charging speed trends been consistent across all regions?

Europe’s charging infrastructure

Across Europe, including the EU, EFTA and the UK, EV Volumes counted 442,804 public charging points. This equated to an increase of 14.4% compared with May 2024.

The region’s rate of growth does appear to have slowed since May 2023, when the tally jumped by 42.3% year on year. This was followed by a 29.1% increase at the same point in 2024.

With a 74.7% share, the majority of infrastructure in the region belonged in the normal speed category. However, the rate at which this category is expanding slowed to 11.7% year on year. This followed growth of 27.9% in May 2024 and 39% in the same month in 2023.

Both the fast and ultra-fast infrastructure groupings were subject to this trend as well. The fast category saw growth slow from 55% in May 2023 to 33.1% 12 months later, then 23.1% this year. This meant the technology took a 24.7% share, while ultra-fast remained stable at 0.6% over the last three years.

The Netherlands boosts numbers

While Europe has seen an increasing amount of public charging infrastructure installed, the spread was far from even. The Netherlands led the way, with 117,413 points recorded by May 2025.

This is not surprising given the country’s booming EV market. In the first five months of the year, the country recorded 80,373 new EV registrations, according to data from ACEA. This meant plug-in powertrains made up 54.1% of all new-car deliveries in the Netherlands from January to May.

Germany had the second-largest number of EV charging points, reaching a tally of 54,681. However, at 15,421 points, Germany had three times the number of fast chargers as the Netherlands at 4,429. In third, the UK reached 50,481 public chargers in total, with 18,587 fast points making up approximately a third of its overall offering.

At the other end of the spectrum, Malta had 75 normal speed chargers available. However, its smaller EV market has already experienced a drop in the first five months of the year. 835 plug-in vehicles were registered, down by 34.9%.

The EU is expected to see public EV charging infrastructure grow thanks to the Alternative Fuels Infrastructure Regulation. This year, charging stations outputting between 22kW and 150kW must be set up every 60km along the TEN-T road network.

There are also local requirements. In Germany, the Masterplan Ladeinfrastruktur, sets out a strategy to reach 1 million public charging points by 2030. Elsewhere, France aims to roll out 400,000 public charging points by 2030.

Way out in front

So, how does Europe compare with other major EV markets? According to EV Volumes, China’s new plug-in vehicle market grew by 42.2% year on year between January and May. This equated to the sale of 4.76 million units, the largest amount globally.

Accordingly, the number of public charging infrastructure far exceeded any other market. By May this year, just under 3.13 million points were available, up by 40.2% year on year. The normal category took a 51.6% share of this total, while 48.3% were fast. Ultra-fast, on the other hand, made up only 0.1% of public charging infrastructure.

As noted by the International Energy Agency’s (IEA’s) Global EV Outlook, there are important regional differences worthy of note. EV drivers in China’s densely populated urban areas rely on public infrastructure. Meanwhile, Europe has a far greater number of private chargers at home.

Uncertainty in the US

Compared with the relatively consistent expansion of charging points in China, the US has seen varied growth. The country recorded 81,693 connectors by May this year, marking a growth of 13.5%.

Normal speed chargers made up the majority of points, accounting for 77.7%, followed by fast points at 17.8%. However, where the US stood out was the far larger number of ultra-fast chargers, which made up 4.5% of plug-in points.

The National Electric Vehicle Infrastructure (NEVI) programme put aside $5 billion (€4.2 billion) to fund fast charging along corridors. However, the IEA highlights that by the end of last year, only $30 million had been spent on points which are now in operation.

Furthermore, these funds were frozen in January 2025 so the new administration could carry out a review. This put the further rollout of public EV charging infrastructure in the US into a far more precarious position.

With so many different approaches across the world, the rollout of public EV charging infrastructure will continue to be uneven.

European EV registrations rise as new model records first win

Battery-electric (BEV) and plug-in hybrid (PHEV) registrations rose across Europe in April, but which newcomer topped the BEV charts for the first time? Autovista24 journalist Tom Hooker breaks down the latest EV Volumes data.

A total of 186,827 BEVs were handed over to customers in Europe during April, up 27.7% year on year. This equated to a gain of 40,506 units. The result also continues the technology’s monthly double-digit growth streak between January and April 2025.

Meanwhile, PHEV volumes increased by 30.6% in the month, reaching 98,330 deliveries. This was the powertrain’s biggest improvement in the first four months of the year.

Registrations of all-electric vehicles totalled 765,820 units over the first third of the year. This resulted in a 27.9% growth compared to the same period in 2024. PHEVs increased deliveries by 11.5% from January to April, with 366,838 units.

Germany once again recorded the highest BEV volumes in Europe during the month. The country accounted for 24.3% of the technology’s total registrations, continuing a rebound from a difficult 2024.

France followed with a 14.3% share, then came the UK which represented 13.2% of the market. Belgium and Norway were the fourth and fifth, recording a 6.7% and 5.9% share respectively.

Germany also led the PHEV market, capturing 24.7% of the technology’s total. The UK landed second with a 14.2% share, followed by France which represented 9.6% of deliveries. Spain ended up fourth with a 9.4% share, as Italy made up 8% of volumes.

New model leads BEV registrations

The Skoda Elroq was the best-selling BEV in Europe in April, with 7,663 registrations. This was the compact SUV’s highest delivery total in only its sixth month on the market. The Elroq accounted for 4.1% of overall sales. Before April, the model had not appeared in the BEV top 10. It sat 17th in the cumulative chart between January and April.

The Volkswagen (VW) ID.3 took second place with 6,938 deliveries, up 33.4% on the same month last year. This marked its strongest monthly result since June 2024 and its highest ranking in the best-sellers table in the first four months of the year. The hatchback claimed a 3.7% market share, up 0.1 percentage points (pp) compared to April 2024.

The combined total of the Renault 5 and Alpine A290 followed, missing out on second place by just 138 units. The pair delivered 6,800 models to European customers, equating to a 3.6% share. It also marked the BEVs’ best finishing position since February.

Just 22 units behind was the VW ID.7 with 6,778 deliveries. This meant volumes of the saloon increased by 633.5% compared to April 2024. It represented 3.6% of the BEV market, up from 0.6%.

Its sibling, the VW ID.4, finished fifth. Its 6,323-unit total was a 4.7% improvement on 12 months prior. Yet, due to increased competition, its market share fell from 4.1% to 3.4%.

Skoda Enyaq struggles

The Skoda Enyaq secured sixth, continuing the dominance of VW Group in April’s BEV chart. The SUV increased registrations by 29% in April to 5,633 units. However, this was the first time it placed outside the top five in the first four months of the year. Its sales may have been impacted by the success of the Skoda Elroq. The Enyaq made up 3% of overall deliveries, stable from April 2024.

The Kia EV3 took seventh, posting 5,574 registrations in its seventh month on the market. This figure translated into a 3% share. The BMW iX1 followed in eighth, with its first appearance in the top 10 this year. It recorded 5,297 deliveries, up 17.6% year on year. The SUV represented 2.8% of the BEV market, down 0.3pp.

Ninth place went to the Tesla Model Y, with 4,805 units. Compared to April 2024, when it led the best-sellers table, this proved a notable slump of 49.9%. It also marked the crossover’s lowest delivery total since October 2022. This caused the Model Y’s market share to drop from 6.6% to 2.6%.

In 10th was the Audi Q4 e-tron, recording 4,595 registrations. This was the SUV’s lowest finishing position in the 2025 results, as its volumes fell by 22.3% year on year. In turn, its market share declined by 1.5pp to 2.5%. This meant that six VW Group models were featured in the BEV best-sellers table for April.

Tesla still tops BEVs

Despite its poor April performance, the Tesla Model Y continued to lead Europe’s BEV market in the cumulative table. Between January and April, it recorded 35,192 registrations giving it a 4.6% market share.

There was a change for position in second, as the VW ID.4 moved ahead of the Tesla Model 3. This was largely due to the Model 3’s 24th-place finish in April. The ID.4 took a 3.5% market share thanks to 26,798 deliveries, while the Model 3 recorded 26,028 registrations and a 3.4% share.

The Skoda Enyaq ranked fourth with 25,540 units, just 11 ahead of the VW ID.7, which saw a boost from strong April sales. Another 109 units behind was the combined total of the Renault 5 and Alpine A290. These models accounted for 3.3% of the BEV market.

In seventh was the ID.3, displacing the Kia EV3. The hatchback posted 24,301 registrations and a 3.2% share. Meanwhile, the EV3 recorded a 3.1% share with 24,007 deliveries.

Then came the Audi Q4-tron with 21,715 registrations, accounting for 2.8% of the overall market. The BMW iX1 completed the top 10, posting 19,676 deliveries and a 2.6% share.

Volvo XC60 recovers

The Volvo XC60 was the most popular PHEV in Europe in April, thanks to 5,093 registrations. However, this signalled a decline of 2% compared to 12 months prior. Its share fell from 6.9% to 5.2%, as competition in the sector intensified.

BYD’s Seal U secured second place with 4,783 units, accounting for 4.9% of total volume. Close behind, the VW Tiguan posted 4,753 deliveries, an impressive 623.4% increase on the same month last year. The SUV captured a 4.8% market share, up 3.9pp.

The BMW X1 followed in fourth, with 3,029 registrations. This was its best result so far in 2025, yet the performance was down 6.7% on April 2024. The SUV captured 3.1% of PHEV volumes, down from 4.3%.

After leading the market in March, the Ford Kuga placed fifth in April. The PHEV recorded 2,949 deliveries, its smallest monthly figure since August 2024. Despite a 7.4% growth in registrations, its market share fell by 0.6pp to 3% due to increased market saturation.

Toyota C-HR registrations surge

Securing sixth was the Toyota C-HR, surging 321.2% year on year with 2,864 units. It accounted for 2.9% of the market, up 2pp compared to 12 months prior.

Seventh went to the Mercedes-Benz GLC. Although it achieved its biggest monthly total so far in 2025, the SUV’s 2,634 deliveries were still down by 23.2%. This translated to a 2.7% share, down from 4.6%.

Just one unit behind was the Cupra Formentor. However, it had contrasting fortunes compared to one year ago, enjoying a 6.2% rise in registrations. Yet, its market share dropped by 0.6pp to 2.7%.

BMW’s 5-Series placed ninth after landing outside the best-sellers top 10 in March. The saloon reached 2,587 deliveries in the month, up 145.2% year on year. The PHEV accounted for 2.6% of the overall total, up from 1.4%.

The Audi A3 closed out the top 10, making its first appearance in the table this year. The model recorded a 2.7% fall in volumes compared to April 2024. However, its 2,538-unit total was the model’s highest monthly figure since then. It took a 2.6% market share, down by 0.9pp.

VW takes fight to Ford

The Volvo XC60 continued to lead Europe’s PHEV market in the year to date, with 19,905 registrations and a 5.4% share. Behind, the VW Tiguan took second from the Ford Kuga. The former recorded 17,646 deliveries and a 4.8% share between January and April. Meanwhile, the Kuga made up 4.3% of PHEV volumes with 15,918 units.

BYD’s Seal U finished fourth thanks to 14,974 registrations. This translated to a 4.1% market share. Then came the Toyota C-HR, with a 3.3% share and 12,193 deliveries. The Cupra Formentor secured sixth, accounting for 3.1% of the overall total, with 11,253 units.

Just 246 registrations behind was the BMW X1, benefitting from a strong April. This gave the SUV 11,007 units and a 3% share. The BMW 5-Series claimed eighth, representing 2.6% of the PHEV market and posting 9,633 deliveries.

The Hyundai Tucson claimed ninth with 8,941 registrations and a 2.4% share. Skoda’s Kodiaq was only 180 units behind the SUV, recording 8,761 deliveries and capturing 2.4% of total volumes.

How many EV batteries were produced globally in 2024?

Which electric vehicle (EV) battery manufacturers produced the most cells in 2024? How many gigawatt hours (GWh) were achieved? Autovista24 special content editor Phil Curry examines the latest data from EV Volumes.

In 2024, the number of electric passenger cars on the global market increased by 26.1%, as battery-electric vehicles and plug-in hybrids grew in popularity. This rise meant that more EV batteries than ever were required to keep up with demand.

In total, gigafactories worldwide achieved a total of 867.8GWh cell output for EV batteries, destined for both passenger cars and commercial vehicles. This was an increase in production of 21.2% compared to 2023.

Battery suppliers measure their output in GWh rather than the total number of units produced. One GWh is equivalent to one million kilowatt hours (kWh), the measurement often found in battery-electric vehicle (BEV) specifications. If an average BEV has a capacity of 50kWh, then 1GWh worth of batteries could supply some 20,000 models.

Despite the volume growth, the improvement was the lowest since EV Volumes began tracking cell output in 2014. In 2023, cell production was up 40%, while in 2022 it grew 73%, and in 2021 total output was up 112% year on year.

However, rather than implying a slowdown in production, the reduction in growth may indicate that more gigafactories have reached their production capacities. Many sites will start with a lower cell output, and can take years to reach their full potential.

CATL’s EV batteries top

Once again, the Chinese supplier CATL led the way in the production of EV batteries. The company was the first ever to break the 300GWh barrier, with a total of 300.8GWh in 2024. This was a 24.8% improvement compared to its total capacity of 2023.

This performance meant CATL dominated the market in 2024, producing 34.7% of the total cell output in the year. This was an increase of one percentage point (pp), as more new players in the market diluted the total shares.

The Chinese battery manufacturer rose to the top of the rankings in 2021 and has remained there ever since. Since 2022, it has almost doubled the total of its nearest competitors. From the start of 2014, it has manufactured 858.6GWh of EV batteries. This makes it the largest supplier by far.

The company is continuing to grow, announcing a joint venture with Stellantis for a large-scale LFP battery plant in Spain last year. This site will be located at the carmaker’s Zaragoza facility, with production expected to begin in 2026. It could reach up to 50GWh capacity, and will help Stellantis provide more affordable EVs to customers.

CATL has also formed a strategic partnership on battery-swapping technologies with Nio. The battery manufacturer will strengthen the carmaker’s battery-swapping networks, and will be integrated into the new firefly brand from Nio.  

Potential for EV batteries

BYD took second place for the third year in a row. The manufacturer saw a cell output of 156.8GWh last year, an increase of 27.5% year on year. This meant the brand produced 18.1% of the total capacity in 2024, an increase of 0.9pp.

Since 2014, BYD has produced 416.1GWh-worth of cells. The brand has been expanding its automotive market scope in recent years and was the leading global EV manufacturer in 2024.

BYD will be hoping to expand upon its popularity this year and beyond. It recently unveiled its ‘Super e-Platform’, which could deliver a range of 400km in five minutes. The technology is expected to be capable of charging at speeds of 1,000KW.

Third place in the table went to LG Energy Solution, meaning the top three in 2024 mirrored the previous year. The Korean company produced 108GWh of cells last year, an improvement of just 1.8% compared to 2023.

This small increase, together with growing competition in the market, meant the brand’s share dropped last year by 2.4pp to 12.4% of total cell output.

The brand, which was the leading supplier in 2020, will be looking to boost its output this year, adding to its 436.7GWH total capacity since 2014. This figure places it second in the all-time table, ahead of BYD.

In December 2024, LG Energy Solution announced a plan with GM to jointly develop prismatic battery-cell technology, extending its partnership with the carmaker. This would allow the battery producer to be the first global battery manufacturer to offer all three cell form factors: pouch-type, cylindrical, and prismatic.

Making moves

In fourth place, Panasonic saw its cell output drop in 2024. The brand maintained fourth place from the previous year, but its 53.1GWh production capacity was down 8.1%. This meant that Panasonic’s hold on the market dropped by 2pp compared to 2023 and sat at 6.1%. Since 2014, the manufacturer has produced 297.2GWh of cells.

Meanwhile, fifth saw the first position change in the top 10. CALB jumped up the table, from seventh position in 2023. Its 39.8GHw capacity last year was an improvement of 58.1%. It took a 4.6% share of the market, up 1.1pp year on year.

CALB’s growth meant that its total output since 2014 totalled 102.1GWh at the end of 2024. The manufacturer has increased production rapidly from a 4.2GWh output in 2020.

This meant that SK On was pushed down into sixth position. The battery supplier was not only overtaken, but it also lost capacity compared to 2023. Its output of 36.4GWh was down 7%, while its market share fell by 1.3pp, to 4.2%. However, its 134.2GWh total capacity over this period kept it ahead of CALB.

Close at the bottom

Close behind in seventh place was Samsung SDI, with a total of 34GWh in 2024. This was also a decline for the brand, dropping 7.5% of capacity from the previous year. The result also impacted market share, falling 1.2pp to 3.9%. Since 2014, the company has produced 131.1GWh-worth of EV battery cells.

The lower positions of the top 10 battery manufacturers table saw a close finish for eighth and ninth places. Narrowly taking the higher spot was Sunwoda. The company produced the best year-on-year increase within the table, with 124.9% more output in 2024, as its capacity reached 17.1GWh.

This increase saw the manufacturer jump from 12th place in 2023. Sunwoda is also the newest producer in the top 10, having only begun its output in 2017. Its market share of 2% was up from the 1.1% it recorded in 2023. Since beginning production, the company has a total cell output of 31.6GWh.

Just below, in ninth position, was Farasis Energy. The second-newest brand, having begun production in 2015, ended the year with capacity of 17GWh. When breaking the results down, there was just 10MWh between eighth and ninth places.

Faris Energy’s 2024 cell volume was a rise of 12.1% year on year. However, due to better results elsewhere, the manufacturer’s market share slipped by 0.1pp to 2%. Its 41.2GWh lifetime capacity kept it above Sunwoda due to an early start to production.

A new name entered the table in 10th position. Gotion ended the year with a cell output of 13.7GWh, up 66.2% compared to 2023. Its 1.6% share was also up, by 0.5pp.

However, between 2014 and 2024, the manufacturer produced 43GWh of cells, more than both Sunwoda and Farasis Energy ahead of it. This result meant Envision AESC dropped out of the top 10.

Is bigger really better for BEV batteries?

Autovista24

Bigger batteries may remedy range anxiety, but smaller power-storage units can reduce costs and purchase prices of battery-electric vehicles (BEVs). Dr Christof Engelskirchen, chief economist of Autovista Group (part of J.D. Power), explores the economies of smaller batteries.

As the BEV market develops, with carmakers introducing new models, not all brands offer a variety of battery-size options. This is a valid approach, as focusing on larger power-storage units helps to tackle both range anxiety and charging anxiety.

This means peace of mind and conveys an impression of being future-proof. This is especially true as charging infrastructure continues to develop across Europe, where it currently may struggle to meet demand.

Few will question the logic of choosing a larger battery, while selecting a smaller one may raise some eyebrows. But is it rational to opt for the biggest battery unit available, especially as it is the most expensive BEV component? The short answer is ‘it depends’.

To understand whether bigger really is better, some facts need to be unpacked. This can be achieved by comparing the standard and the long-range variants of the Tesla Model Y and Volvo EX30, with a focus on the rear-wheel drive (RWD) single-motor variants.

The Model Y was not only the best-selling car in Europe last year, but it also took the global title. Meanwhile, the recently introduced EX30 emphasises mass-market compatibility, in a vehicle segment where this has been absent for so long.

The cost of greater range

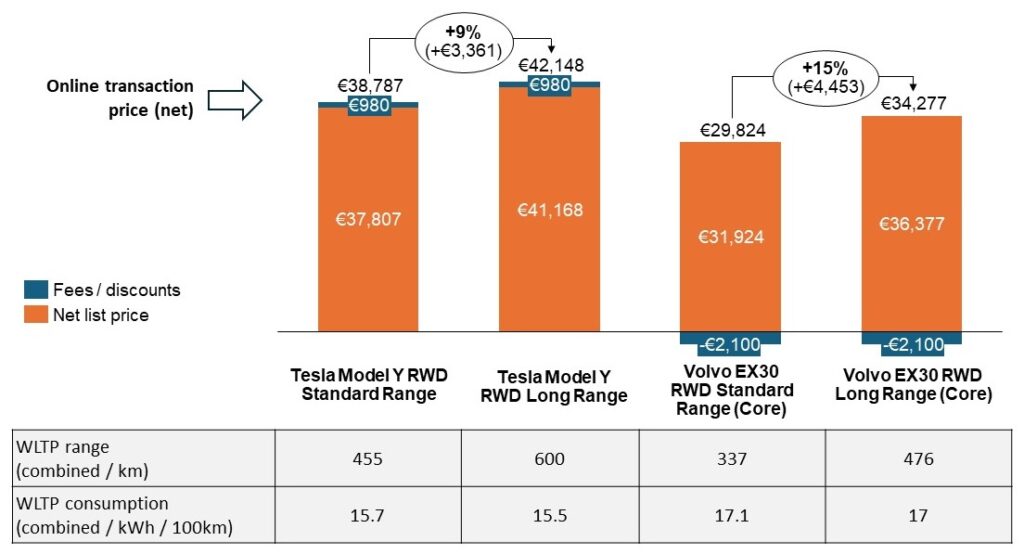
When comparing online transaction prices for new vehicles after fees and applicable company discounts, the initial challenge for bigger batteries is revealed. An additional range of approximately 140km costs between €3,400 and €4,500 (net). This price increase is smaller for Tesla than for Volvo, both in absolute and relative terms.

As a side note, the Model Y is attractively priced, and Volvo needs to offer an additional discount of €2,100 (net) to maintain the required distance between transaction prices. The larger Model Y also offers three times the boot volume of the EX30, while also being around 50cm longer and nearly 10cm taller and wider.

Transaction price difference by battery size for Tesla Model Y and Volvo EX30 in Germany

BEV batteries
Source: Manufacturer websites and Autovista Group analysis.

Note: € values are net (exclude VAT). Data from May 2024.

Surprisingly, the WLTP consumption figures do not differ much between each model’s battery variants. In fact, the long-range versions seem to operate more efficiently. Both carmakers use different battery technologies according to the intended range. Their smaller batteries use a lithium-iron-phosphate (LFP) chemistry, while the larger units use a lithium nickel manganese cobalt oxide (NMC) makeup. This is the primary contributing factor to the different battery efficiencies.

Small and economic?

So, how are battery sizes handled in leasing contracts of 36 months and 60,000km? Under its business leasing offer, Tesla charges a moderate €42 (net) per month for more range. This takes the range of the Model Y from an already considerable 455km (WLTP) to 600km (WLTP).

Across one year this accumulates to €504 of additional cost, and roughly €1,500 over three years. This is less than half of what would be paid if the vehicle was purchased outright.

Care by Volvo, the carmaker’s long-term rental and subscription service model, sits at a monthly premium of €59. This adds up to €708 a year and approximately €2,100 over three years. Under this plan, the EX30 goes from a lower range of 337km (WLPT) to a solid 476km (WLTP).

Despite these relatively small uplifts, the price still clearly points towards the smaller battery being the more economical choice. However, it is important to consider how usage impacts utilisation costs. When driving in higher-mileage scenarios, BEVs with a smaller range may require substantially more frequent public charging stops, which are more expensive and less convenient.

Testing with two scenarios

Two scenarios can be used to simulate these economic conditions, alongside certain assumptions.

In the first scenario, 80% of the annual 20,000km mileage covers short trips where all charging takes place at home or the workplace. Here, electricity costs are comparatively lower, at €0.25 per kWh (net) in Germany.

The remaining 20% of the annual mileage (4,000km) is made up of long-distance trips. This consists of four short weekend or business trips of 500km each and two larger journeys of 1,000km each.

It is assumed that the driver charges the vehicle to 100% ahead of each trip. Additionally, public charging points are only used when the remaining range reaches 40km, at which point the battery is recharged to 80%. This makes sense in terms of convenience, as it takes roughly the same time to charge from 20% to 80% as it does from 80% to 100%. The costs of fast charging at public infrastructure are set at €0.5 per kWh (net) in Germany.

For the sake of simplicity, real-life ranges are assumed to be 80% of the respective WLTP values for short distances and 65% for longer journeys, conducted at much faster speeds. These assumptions are in line with real-life consumption levels which have been observed, recorded and published in the public domain. Regardless, the overall results are not sensitive to these assumptions.

In the second scenario, the driving pattern is modified so that half of the mileage, 10,000km, is spent on longer trips. This equates to 10 weekend or business trips of 500km each and five longer journeys of 1,000km. The remaining assumptions are unchanged.

Smaller cost savings

Under these scenarios, public-charging costs come down when switching from a short-range model to a long-range one. This is the case for both the Model Y and the EX30, however, the savings are not as significant as some might hope.

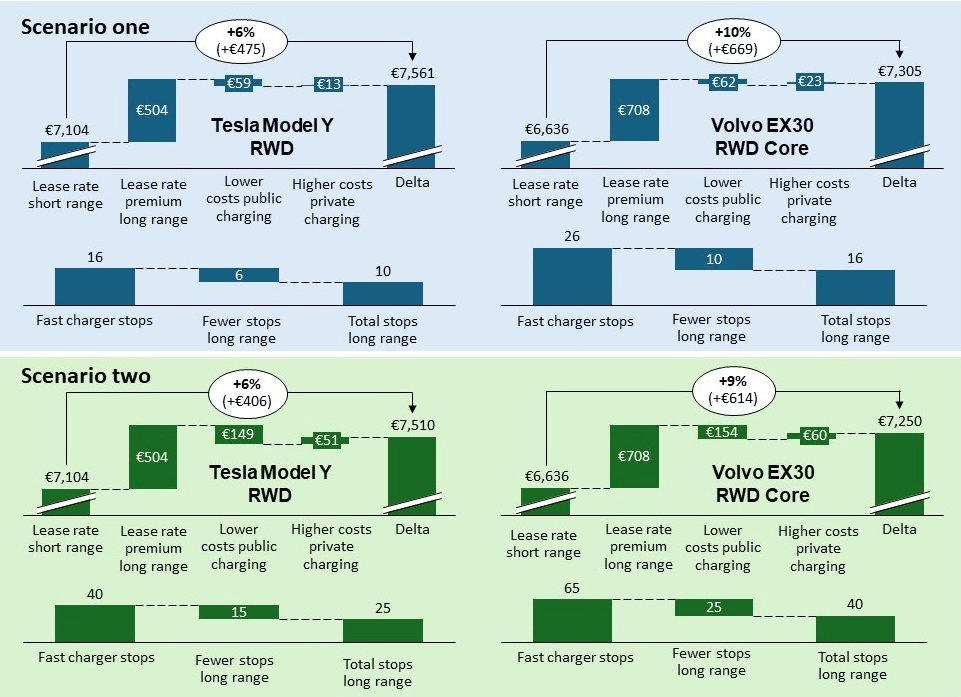
The annual cost savings accrued due to less public charging is only between €59 and €62 a year in scenario one and between €149 and €154 in scenario two. Savings partially erode as the car still needs to be charged, albeit at more affordable domestic or company wallboxes.

Annual cost difference when moving from a standard to a long-range BEV in Germany

electric vehicle
Source: Manufacturer websites, Autovista Group research and analysis.

Note: Leasing rates and charging costs are in € and net (exclude VAT). Vehicles are held for 36 months and the annual mileage is 20,000km. The starting point of ‘lease rate short range’ comes from manufacturer websites and represents the annualised monthly business rate. To balance this comparison, the Tesla Model Y has €111 added each month for insurance. This is because the carmaker does not include insurance in its offer, but Volvo does. Data is from May 2024.

Overall, with net cost savings, it is still more economical to opt for the smaller battery in both scenarios. This means the total cost of ownership (TCO) advantages remain for the smaller battery versions after simulating the more expensive stops at public chargers.

There is a noticeable difference between Tesla and Volvo. The annual TCO difference for the Model Y is only between €406 and €475 in both scenarios. This is because of the smaller premium required for the long-range model versus the standard-range version when compared to Volvo. For the EX30, the TCO difference is between €614 and €669 per year when choosing the larger battery over the standard one.

Calculating convenience

The added convenience of fewer public charging stops must also be considered for those BEVs with a bigger battery.

The standard Tesla Model Y offers such a good range it can handle the use case of scenario one quite well, requiring only 16 stops a year. Meanwhile, the long-range version reduces the annual number of stops from 16 to 10.

Here, the case for a smaller battery may be economically apparent, but for many people, the long-range version offers added flexibility at a small additional cost.

The longer-range variant of the Volvo EX30 reduces the number of stops more significantly from 26 to 16. Therefore, the added convenience of the longer-range version is considerable, but then so is the price premium. This makes it a tie in terms of choice, with budget and actual use case the likely deciding factors.

In scenario two, the standard-range Model Y makes 40 stops a year at public chargers. This will be enough to push most customers towards the long-range version. The TCO disadvantage of the bigger battery comes down to only €406 a year, or €27 per saved stop.

Similarly for the EX30, investing the additional €614 a year in scenario two would make sense. This would bring the stops down to 40 from 65 with the standard range version and costs €25 per saved stop.

A balanced decision

So, if the price or leasing rate increase for a larger battery is small, going big will mean an extra layer of convenience and security. This also reduces stress on developing infrastructure, with more stops requiring more chargers.

If the cost uplift is more substantial, smaller batteries will still deliver, while remaining the more economical choice. This is especially true if shorter trips define a person’s driving pattern.

However, when longer journeys underline a person’s driving pattern, it will be worth assessing the number of stops needed with the given battery variant. This will ensure a well-balanced decision between added costs, extra flexibility and greater convenience.

This content is brought to you by Autovista24.